How to Read Baseball Statistics: From Batting Average to WAR
Learning how to read baseball statistics opens up a completely different layer of the game. Baseball has more data than virtually any other sport, and once you know what each number means and why it matters, watching a game and following a season becomes far richer. We have taught these concepts to players, parents, and fans at every level, and the single biggest impact is always the moment someone moves from just watching outcomes to understanding what the numbers tell us about skill.
In this guide, we start with the traditional stats most fans already know, then move into the modern metrics that tell us far more about what is really happening on the field.
- A batting average of .300 or above is considered excellent at the major league level; the MLB average typically sits around .250–.260.
- OPS (On-base Plus Slugging) is the most accessible advanced hitting stat — an OPS above .900 is elite, above .800 is above average.
- WAR (Wins Above Replacement) of 5.0 or higher in a single season is All-Star caliber production.
- ERA is the most common pitching stat, but FIP (Fielding Independent Pitching) removes fielder influence and tells us more about pitcher skill alone.
- Defense is the hardest thing to measure in baseball — no single defensive stat tells the complete story.
- Context always matters: park factors, era adjustments, and sample size all affect how we interpret any individual number.
Traditional Hitting Statistics
Batting Average (BA / AVG)
Batting average is calculated by dividing hits by at-bats: H ÷ AB. A player with 150 hits in 500 at-bats has a .300 batting average.
- Elite: .300 and above
- Above average: .270–.299
- Average: .250–.269
- Below average: Below .250
Batting average has limitations — it does not account for walks, does not weight extra-base hits differently from singles, and does not tell us about power. But it remains the most recognizable hitting stat in baseball and is a reasonable basic measure of contact quality.
Home Runs (HR) and RBIs
Home runs need no formula — they are simply how many times a batter hit the ball over the fence. RBIs (runs batted in) count how many runs a batter drove in through any plate appearance. Both stats are heavily context-dependent: a batter with more runners on base will naturally have more RBI opportunities, and a batter in a hitter-friendly ballpark will hit more home runs. Read them with that in mind.
Runs (R) and Stolen Bases (SB)
Runs scored measures how many times a player crossed home plate. Stolen bases count successful steals. These tell us about a player’s speed and baserunning aggression but not their efficiency — stolen base attempts is the partner stat you need to evaluate the decision-making quality.
On-Base and Slugging Statistics
On-Base Percentage (OBP)
OBP measures how often a batter reaches base by any means: hits, walks, or hit by pitch. It is calculated as: (H + BB + HBP) ÷ (AB + BB + HBP + SF).
OBP is more predictive of runs scored than batting average because it includes walks, which batting average ignores entirely. A player who draws 80 walks per year and hits .265 contributes more offense than a player who hits .290 but never walks.
- Elite: .380 and above
- Above average: .340–.379
- Average: .310–.339
Slugging Percentage (SLG)
Slugging percentage measures power by weighting hits by their value: (1B + 2×2B + 3×3B + 4×HR) ÷ AB. A single is worth 1, a double is worth 2, a triple worth 3, a home run worth 4.
- Elite: .500 and above
- Above average: .450–.499
- Average: .390–.449
OPS: The Most Accessible Advanced Stat
OPS combines OBP and SLG into a single number: OPS = OBP + SLG. It is not a perfectly precise measure (adding two differently-scaled statistics is mathematically impure), but it is highly correlated with run production and is the single best quick-look hitting stat available.
- Elite: .900 and above
- Above average: .800–.899
- Average: .700–.799
- Below average: Below .700
Pitching Statistics
ERA (Earned Run Average)
ERA calculates the number of earned runs a pitcher allows per nine innings: (Earned Runs ÷ Innings Pitched) × 9.
- Elite: Below 3.00
- Above average: 3.00–3.79
- Average: 3.80–4.50
- Below average: Above 4.50
ERA is useful but flawed — it includes the quality of the defense behind the pitcher and is affected by sequencing (two walks that score on a hit look much worse than a home run in ERA, even though the home run produced more runs).
WHIP (Walks and Hits Per Inning Pitched)
WHIP = (Walks + Hits) ÷ Innings Pitched. This stat tells us how many baserunners the pitcher allows per inning — a direct measure of how often they put runners on base. A WHIP below 1.00 means the pitcher allows fewer than one baserunner per inning, which is genuinely elite.
- Elite: Below 1.00
- Above average: 1.00–1.15
- Average: 1.16–1.30
Strikeout Rate (K/9 or K%)
K/9 measures strikeouts per nine innings; K% measures the percentage of batters faced who strike out. Higher is better for pitchers, though elite strikeout pitchers do not necessarily have the lowest ERAs — contact management also matters.
Advanced Metrics That Tell the Real Story
FIP (Fielding Independent Pitching)
FIP isolates what a pitcher actually controls: home runs, walks, hit batters, and strikeouts. It strips out defense entirely. The formula is complex but is calculated automatically on sites like Baseball Reference.
A pitcher with a 4.20 ERA and a 3.40 FIP had a bad defense behind them — their true performance was much better than ERA suggests. A pitcher with a 3.40 ERA and a 4.20 FIP was benefiting from excellent defense or fortunate sequencing.
WAR (Wins Above Replacement)
WAR is the most encompassing single-number evaluation stat in baseball. It estimates how many more wins a player produced compared to a freely available replacement-level player (a minor leaguer or bench player). WAR accounts for hitting, baserunning, and defense for position players; it accounts for pitching value for pitchers.
| WAR Range | Classification |
|---|---|
| 8.0+ | MVP-level season |
| 5.0–7.9 | All-Star caliber |
| 3.0–4.9 | Solid regular / above average |
| 1.0–2.9 | Role player |
| Below 0.0 | Below replacement level |
WAR is calculated differently by different systems (Baseball Reference uses rWAR; FanGraphs uses fWAR), so comparisons across systems should be done with care. Our full breakdown in the What is a Good WAR in Baseball article explains the differences in detail.
wOBA and wRC+
wOBA (Weighted On-Base Average) assigns proper run values to each outcome (walk, single, double, triple, home run) rather than the approximate weighting that OPS uses. It is the most accurate measure of offensive contribution per plate appearance.
wRC+ (Weighted Runs Created Plus) takes wOBA and adjusts it for park and era: a wRC+ of 100 is exactly league average; 130 means 30% above average; 70 means 30% below average. This makes cross-era comparisons meaningful.
Defensive Statistics
Fielding Percentage
Fielding percentage measures how often a fielder makes a clean play when the ball is hit to them: (PO + A) ÷ (PO + A + E). It is easy to understand but deeply limited — it only counts plays where the fielder got to the ball. A shortstop with poor range may never make errors on balls they cannot reach, appearing to have excellent fielding percentage while being an inferior defender to a shortstop who covers more ground and occasionally misplays difficult chances.
UZR and OAA
Ultimate Zone Rating (UZR) and Outs Above Average (OAA) are more sophisticated defensive metrics that account for the range a fielder covers, not just whether they handled balls they reached. These stats have limitations (they require large samples to stabilize) but are far more informative than fielding percentage. Find them on Baseball Reference and FanGraphs.
Where to Find and Use These Stats
The Best Stat Resources
MLB.com’s official glossary defines every standard statistic used in professional baseball. Baseball Reference (baseball-reference.com) is the gold standard for historical data, searchable by player, year, team, or virtually any combination. FanGraphs provides advanced metrics including FIP, wOBA, and wRC+.
For player development purposes, understanding what these numbers mean for your own game is just as valuable as reading them for MLB players. Our complete breakdown of what makes a good batting average is a useful companion read, and our explainer on what BB means in baseball covers walks and their strategic importance in full.
Frequently Asked Questions
What is a good batting average in baseball?
A .300 batting average is the traditional benchmark for excellence at the major league level. The MLB average typically sits around .250–.260. At the youth and high school level, averages are less meaningful because of variable competition quality and fewer plate appearances.
What does OPS mean in baseball?
OPS stands for On-base Plus Slugging. It combines a batter’s on-base percentage (how often they reach base) with their slugging percentage (how much power they generate) into a single number. An OPS above .900 is elite; above .800 is above average; the league average typically sits around .720–.750.
What is a good ERA for a pitcher?
An ERA below 3.00 is elite at the major league level. Between 3.00 and 3.79 is above average. Around 4.00 is roughly average for a starter. ERA varies by era — pitching in the 1990s and early 2000s (the high-offense period) produced higher ERAs league-wide than today.
What is WAR in baseball?
WAR stands for Wins Above Replacement. It estimates how many additional wins a player produced compared to a replacement-level player. A WAR of 5.0 or higher is All-Star caliber for a single season. Career WAR is used heavily in Hall of Fame discussions — players with career WAR above 60 are strong Hall of Fame candidates by that metric.
What is FIP and how is it different from ERA?
FIP (Fielding Independent Pitching) measures only what the pitcher directly controls: home runs, walks, and strikeouts. ERA includes the defense behind the pitcher. When a pitcher’s FIP is much lower than their ERA, it often means bad luck or poor defense inflated their ERA. FIP is a better predictor of future ERA than current ERA itself.
What statistics should I look at first when evaluating a hitter?
Start with OPS for a quick summary of overall offensive value, then look at OBP (plate discipline), slugging (power), and strikeout rate (contact quality). For context, compare to league average — a .800 OPS in a low-offense year is more valuable than a .800 OPS in a high-offense year. wRC+ adjusts for this automatically.
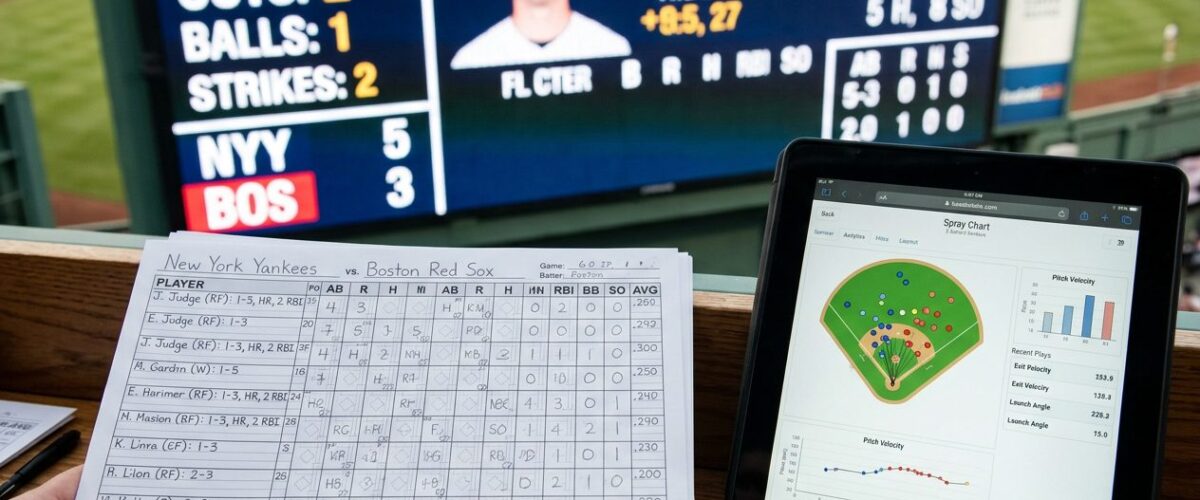
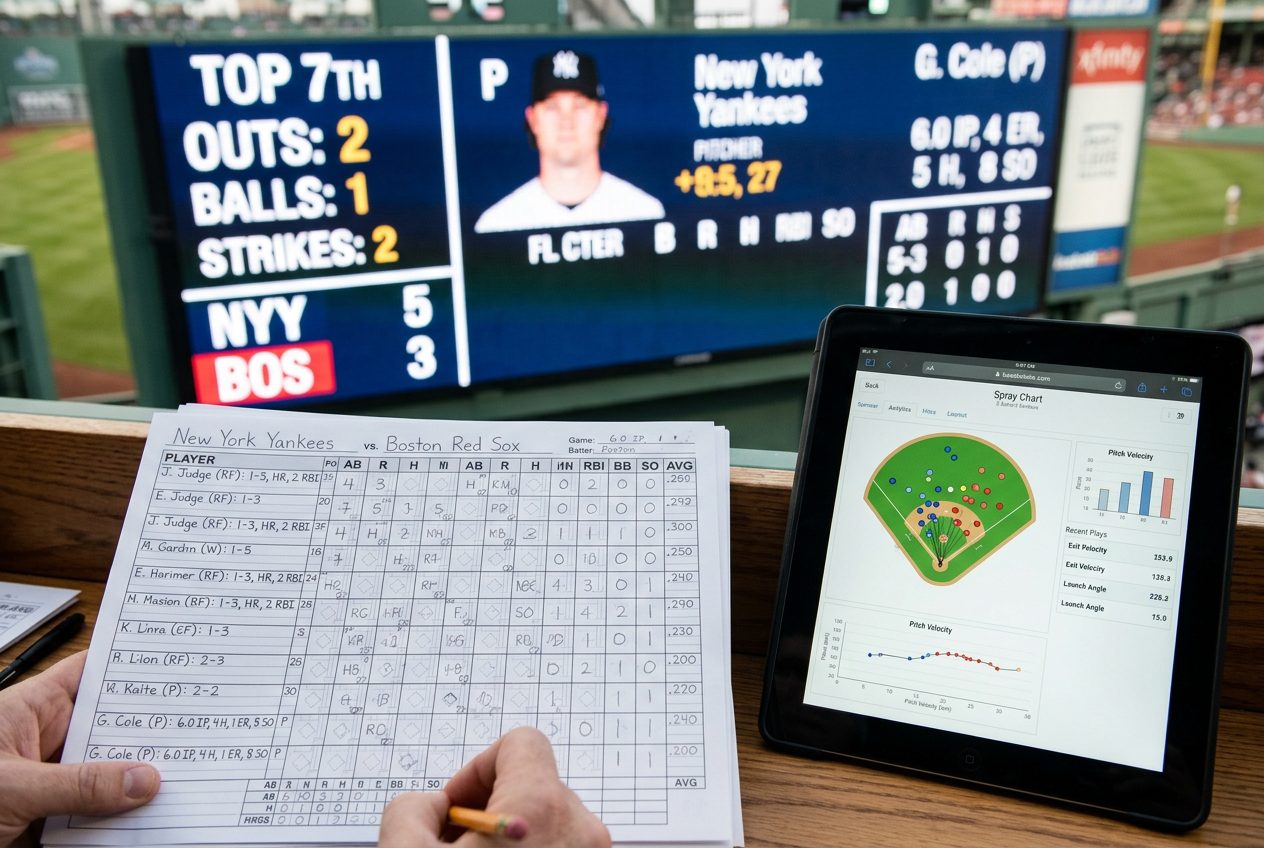
How do I read a baseball box score?
A standard box score lists each player’s position, at-bats (AB), runs (R), hits (H), RBIs, and sometimes walks and strikeouts. For pitchers, it shows innings pitched (IP), hits allowed, runs (R), earned runs (ER), walks (BB), and strikeouts (K). The full game summary also includes team records and the score by inning.